I won't deny that Mission-X had a long waited feature that I did not find the time to implement, and that was the "debug" screen.
I guess that you won't be surprised if I told you that once it became needful to my use case, I invested more time and effort to extend it to where it is now.
The first time I truly needed an extended debug screen was when I started working on the story based mission - "The Artifact", During the second chapter it got even more development time as the story progressed and the mission became more complex.
This was not the first time I implemented a debug screen, I did the same in Mission-X v2.x, so I knew what kind of information I wanted to see.
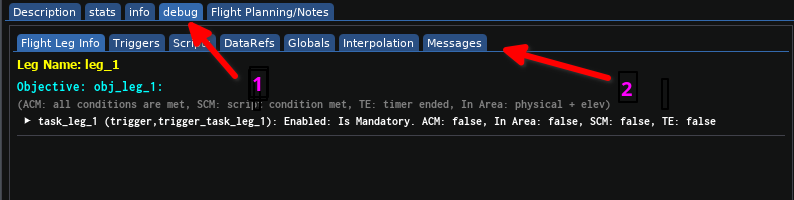
1. The "debug" tab is visible only during active missions.
2. Each tab holds different information to let you easily find and watch as the mission progress.
2. Each tab holds different information to let you easily find and watch as the mission progress.
Dumping in memory XML info
The most basic information I wanted to see was the "in memory XML information" that we loads and being modified, to better understand what the plugin "see" and "use". For that I created the "flush" element buttons in the "Setup" screen, you can find them in the "Designer" tab.
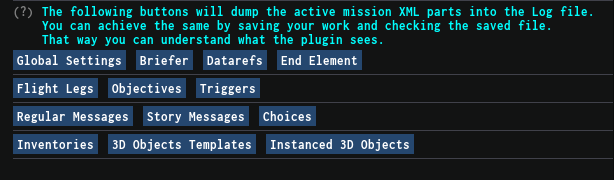
FYI: The dumped elements might have mixed attributes in them due to internal work of the plugin, for example, if a trigger is based on radius, we might see some sub-element information copied to the main element tag to speed the search for the plugin.
The dumped information is written into the "missionx.log" file, found in the plugin folder and not in the Log.txt file.
The dumped information is written into the "missionx.log" file, found in the plugin folder and not in the Log.txt file.
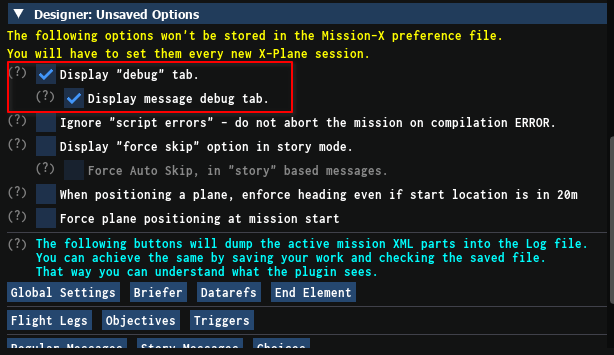
Enabling the DEBUG tab
Displaying the DEBUG information has it's toll on the overall FPS, this is why you should enable it only when needed.
When using the "DEBUG" binaries, it is enabled by default.
When using the "DEBUG" binaries, it is enabled by default.
Flight Leg Info - Tab
The "Flight Leg" information tab holds the current mandatory and optional tasks in the flight leg at hand.
The information is squeezed into a small space to have as many information as possible.
The information is squeezed into a small space to have as many information as possible.
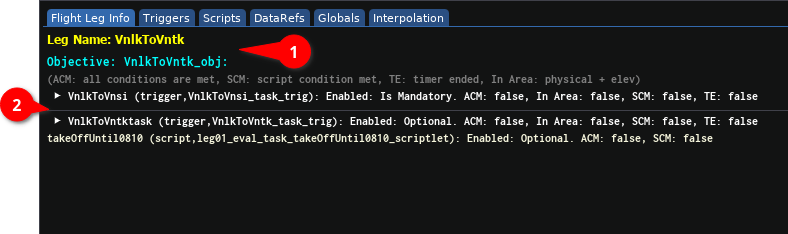
1. At the upper part you will see the current "Flight Leg" and "Objective" names.
2. List of tasks as an expended tree node. The tree header holds the main information we need to immediately diagnose the progress of the task (A topology of the acronym of the tree header, is visible above the tree nodes).
2. List of tasks as an expended tree node. The tree header holds the main information we need to immediately diagnose the progress of the task (A topology of the acronym of the tree header, is visible above the tree nodes).
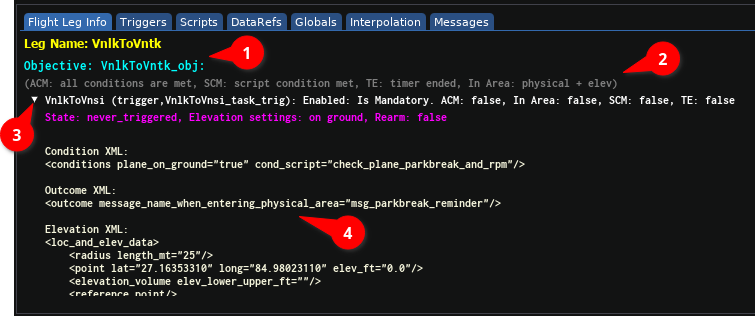
If you need a raw information of the "in memory" data, you can expand the "task" node, and see the state of the task and its main XML elements that it is based on. It is limited to triggers and not scripts.
In the example above, (3) the task node is expended, and you can see the (4) raw XML data of the trigger that the task is based on.
Unfortunately, the task's based trigger can't be manipulated during the flight, only linked triggers can be tested from the "debug" screen.
In the example above, (3) the task node is expended, and you can see the (4) raw XML data of the trigger that the task is based on.
Unfortunately, the task's based trigger can't be manipulated during the flight, only linked triggers can be tested from the "debug" screen.
Triggers Tab
The "Triggers" tab only displays "linked" triggers defined in the active flight leg.
The "Triggers" tab holds all triggers that are linked to the active "flight leg", for triggers that are based on physical location you should see a rough estimation to their centre.
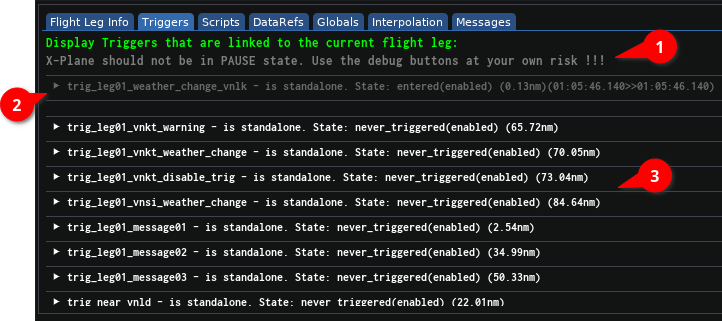
When you debug your mission, (1) it is advisable that you disable the "auto pause" option in 2D mode(can be done in the setup or other debug tabs).
(2) When a trigger is activated, it will be moved to the upper part of the screen and its colour will gradually change to "dim grey". An activated trigger will hold execution time in parentheses.
(3) The bottom part of the screen will hold triggers that were never activated or their state was reset. Their colour will be white.
Remember: Any trigger that holds timing information, means that it was activated, even if you don't see it in the upper part.
To see the triggers raw data you can expend its node.
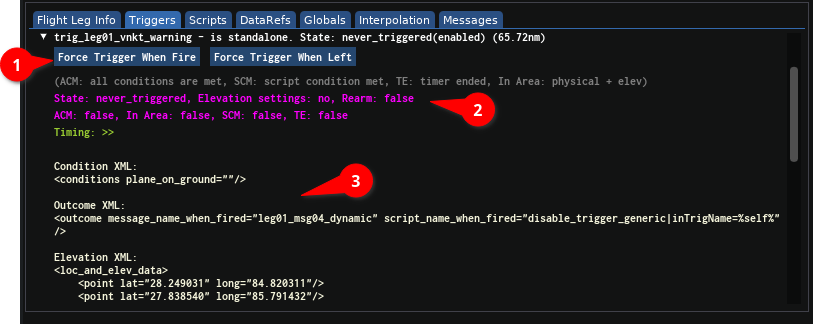
Once you expend the node, you will have the option (1) to manually force the trigger events (use this at your own risk). The benefit is that you don't have to fly the route in order to test the outcome of the trigger.
This is the fastest way to debug your linked triggers without moving the plane, and it is a useful tool to save your time.
It is still your responsibility to test the integration fully, but to pin point issues in your definition or your code, this is a useful tool.
For example:
I had to test a Task based trigger. To do that I defined the trigger as a "linked" trigger to the "leg" element, that way I was able to immediately force and test its outcome, without flying the route.
(2) You can still see the trigger state and timing when the node is expended. Always pay attention if there is any "Timing" information, since that information alone determine if the trigger was really activated at some point.
(3) If you want to see the triggers definition, you could check the raw data. This is useful only for physical based triggers.
Scripts Tab
The script tab is another handy tool to watch and debug your embedded script code.
Like the triggers tab, each line holds the script name, its state and if it was executed.
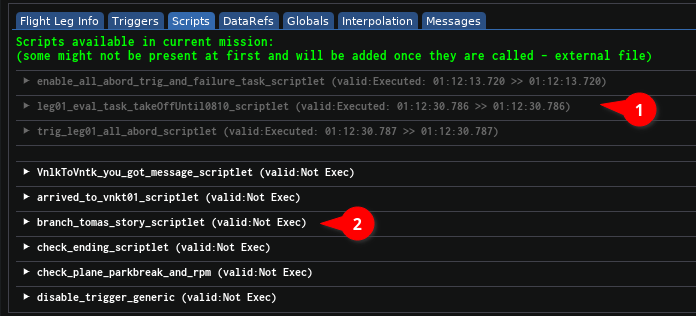
The "scripts" screen can display "scriptlet" and "imported script files" by using the <file> sub-element in the <embedded_scripts> root element.
(1) Activated scripts will be shown at the upper part of the screen. Each activated script will display the last execution time.
(2) Non active scripts will be shown at the bottom part of the window.
If a node holds timing information it means that it was activated at least once, despite its location in the screen.
One of the useful part of this tab is the ability to edit the "in-memory" script and test it on the fly.
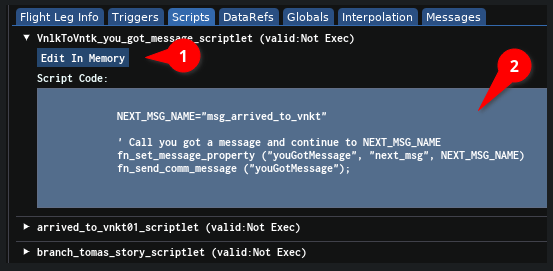
Extending the "script" node, will reveal the script code (2) and an option to edit it in memory (1).
Remember, modifying the in memory script won't modify the "physical" mission file.
Remember, modifying the in memory script won't modify the "physical" mission file.
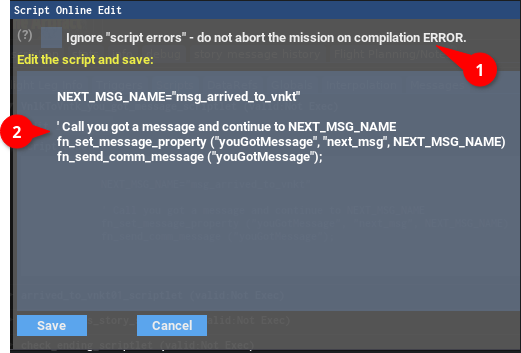
When opening the edit screen, it is important to "check" the "ignore script errors" option (1). That way the mission won't immediately abort if there is any issue with the script code.
You can then modify the script text, save it and test it.
If the script is part of a trigger or a message, you could "force" the trigger event in the "Triggers" screen or message in the message tab.
Once done, remember to copy the code to the original mission file. If you save the mission progress (Savepoint), then the modified code will be saved in the ".sav" file but not in the original mission file.
Dataref Tab
If you defined dataref elements in your mission, to use in your scrips, you could check their values in this screen.
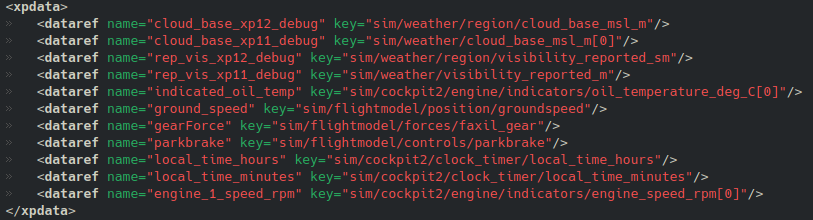
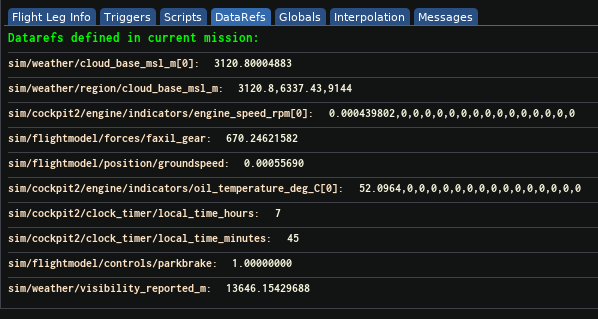
You can't edit the datarefs values in the "debug" screen. For that you can use other plugins, like the "DataRefTool" one.
Globals Tab
In some cases we use "Global Variables" in our mission. This can be useful when we want to track some progress in our embedded script to make complex decisions as other stages of the mission, like branching story messages.
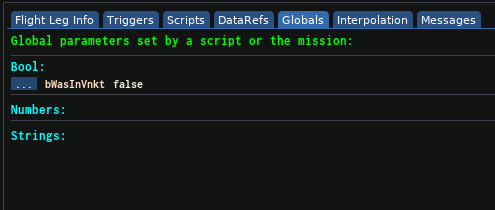
Globals can be modified using the button "[...]".
For boolean globals, enter "true/false" or "yes/no".
For boolean globals, enter "true/false" or "yes/no".
Interpolation Tab
The most common use of interpolation option, in a mission, is to modify weather datarefs over a period of time to make it more or less challenging dependent on the situation at hand.
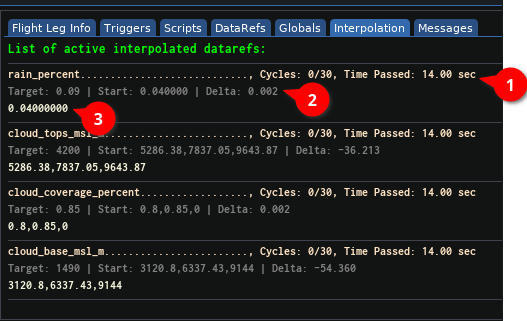
Each interpolated dataref, holds three information lines:
The progress is always linear.
For weather, in X-Plane 12, modified weather datarefs will be updated once per minute regardless of the cycle timing. This is why for weather the cycle time is at least 60 seconds.
- Information regarding the dataref name, number of cycles and time elapsed.
- The target value to reach, the delta for each cycle and the starting value.
- The current value it holds.
The progress is always linear.
For weather, in X-Plane 12, modified weather datarefs will be updated once per minute regardless of the cycle timing. This is why for weather the cycle time is at least 60 seconds.
Messages Tab
The <message> tag is one of those elements that evolved over the plugin life and it became one of the more useful elements in mission designing, especially when it comes to "story mode".
A message has its message text, but it also holds sound channels that you might want to test.
A message has its message text, but it also holds sound channels that you might want to test.
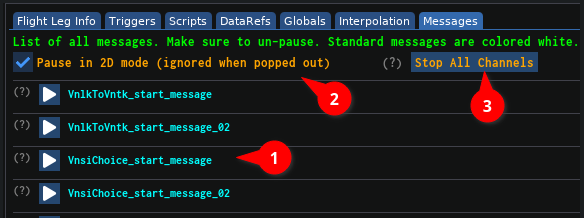
The main goal of the "message" tab is to test the "sound" channels of the message and its "post" actions.
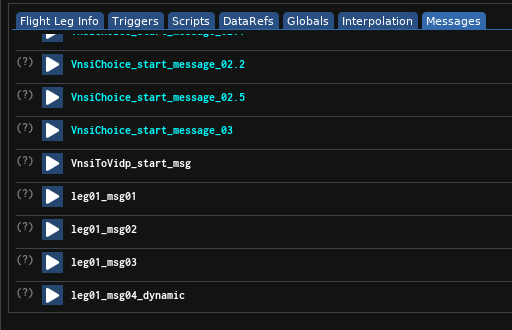
- The messages have two colours, white and aqua. Aqua represent "story mode" messages.
- It is highly advisable to test this when X-Plane is not paused (make sure to un-check the pause option).
- You can force the ["abort"] all sound channels before/after or during the test.
Example:
When I tested the volume of a "long" background sound file, I could abort it in order to continue testing other elements and not listen to it until it ends.
Summary
The debug screen became a useful tool for me when I worked on complex missions, it is not without it's flows but I highly recommend using when you need a better insight of an issue in your mission that you can't resolve easily.
You can Opt-In or Opt-Out in the "Setup > Designer" screen.
If you use the "debug" binaries, it is available by default.
I strongly suggest to focus at one issue at a time and the best way to do this is by progressing a complex mission step by step, while testing each aspect.
During "Chapter two" of "The Artifact" mission, I had many short scripts and branching "story" messages that I had to test. Doing the initial tests without flying the route is a time saver, but as the mission is reaching the release date, it gets harder to just do a pin-point test, you need to test the whole flow of the mission to make sure that things behave as intended, this is why I'm using:
For example:
I might have an ending "story message" in one leg, and the continue "story message" will be at the start of the next leg. This allows me to branch the story messages, and to define boundaries between the content of different times of the story.
In "simple" driven missions, those that are not narrative based, it is simpler to manage them if you work in serial fashion, test first flight leg, then add and test the second one and so forth.
I hope this insight to the DEBUG screen, provided you with some tools on how to use the DEBUG screen and make your mission testing simpler.
Blue Skies
Saar
You can Opt-In or Opt-Out in the "Setup > Designer" screen.
If you use the "debug" binaries, it is available by default.
I strongly suggest to focus at one issue at a time and the best way to do this is by progressing a complex mission step by step, while testing each aspect.
During "Chapter two" of "The Artifact" mission, I had many short scripts and branching "story" messages that I had to test. Doing the initial tests without flying the route is a time saver, but as the mission is reaching the release date, it gets harder to just do a pin-point test, you need to test the whole flow of the mission to make sure that things behave as intended, this is why I'm using:
- The DEBUG build of the plugin.
- I set the "designer_mode" attribute to "yes" in the <MISSION> element.
- Set the "<designer force_leg_name="" />" sub-element attribute in the <global_settings> element, to start the mission in a specific "leg".
- Use the "debug" screen to better understand what is going on inside the plugin during specific phases of the mission or to debug a script.
For example:
I might have an ending "story message" in one leg, and the continue "story message" will be at the start of the next leg. This allows me to branch the story messages, and to define boundaries between the content of different times of the story.
In "simple" driven missions, those that are not narrative based, it is simpler to manage them if you work in serial fashion, test first flight leg, then add and test the second one and so forth.
I hope this insight to the DEBUG screen, provided you with some tools on how to use the DEBUG screen and make your mission testing simpler.
Blue Skies
Saar


 RSS Feed
